You can get a nice visualisation of all the websites that you have visited. You can see which websites were visited in the background (without your intention), which are tracking your activity and many more.
Data can be filtered to isolate and investigate specific parts. The generated visualisation graph can be manipulated, enriching it with new entities.
Statistics over the generated visualisation graph are dynamically calculated during the execution. Per-node statistics are also calculated, helping the user to identify domains with specific properties.
Both the raw captured data and the visualisation graph can be exported in .csv files. They can be used to analyse the data further in more advanced analytics tools.
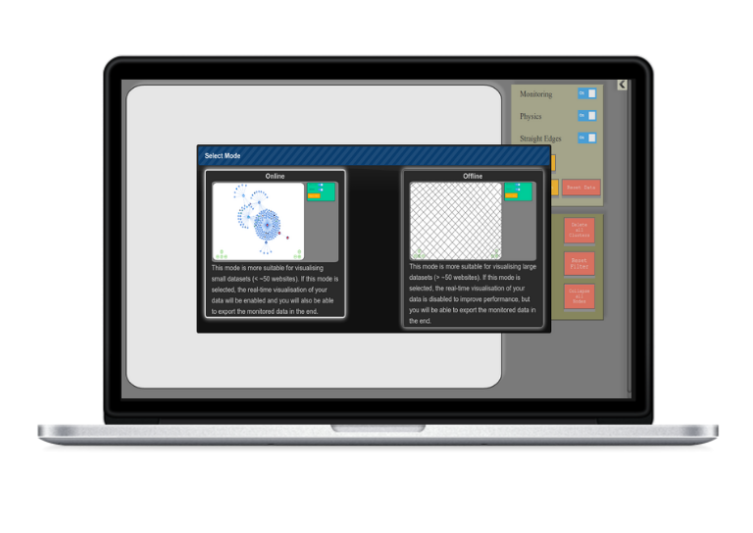
Depending on the size of the browsing activity you want to capture, you can enable or disable visualisation for performance reasons. If the visualisation is enabled, you can filter the graph and manipulate it.
Filter the visualisation graph to reduce noise
If you visit a lot of websites, the graph's size might obstruct you from identifying desired patterns. Using filters, you can show only parts of the graph that you are interested in.
Cluster related domains
The application creates a separate node for each visited domain. You might need to observe an aggregated behaviour of several domains. For instance, you might need to cluster all sub-domains of a specific root domain into a single node, or you might even want to cluster domains from different organisations, such as Youtube with Google.
Expand resources for a fine-grained analysis
By default, only domain nodes are shown by the application. In order to make a more detailed investigation, you can expand all the resources of a domain and observe where each resource was requested from and what it requested as well.
Not all entities of the visualisation are the same. Domain-related statistics are automatically maintained for the generated graph, while there are also per-node metrics, quantifying specific behaviours.
Leverage the domain model
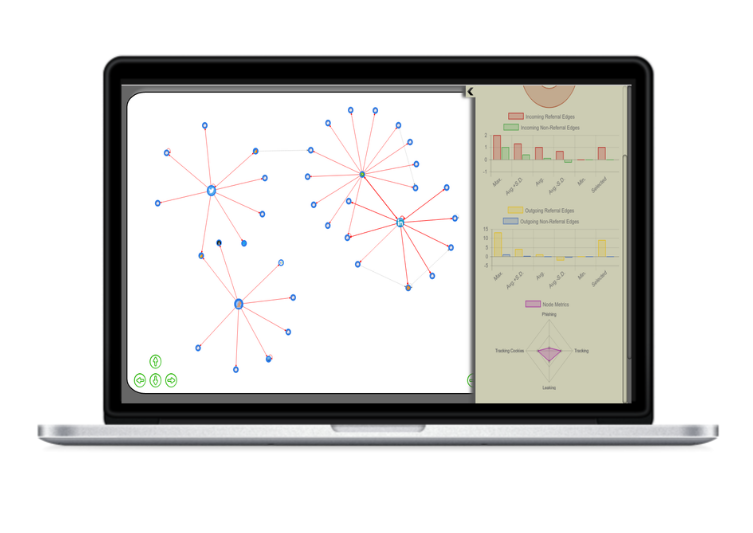
Distinguish first-party from third-party domains from the size of a node. Domains you have visited directly (first-party) are bigger. Distinguish between referral (red) and non-referral edges (grey).
Take advantage of graph statistics
Statistics over the graph are calculated in real time, including percentage of first-party and third-party domains and distribution statistics for different types of edges.
Use defined metrics to classify domains
Domain-specific metrics calculated for each node can assist characterisation of domains, such as potentially phishing domains, domains that are tracking you browsing activity or domains that are leaking a big part of your activity on them to other websites.
As every application, Monitorito cannot do everything. This is the reason why it is integrated with other analytics tools, by allowing the user to export all data in .csv files.
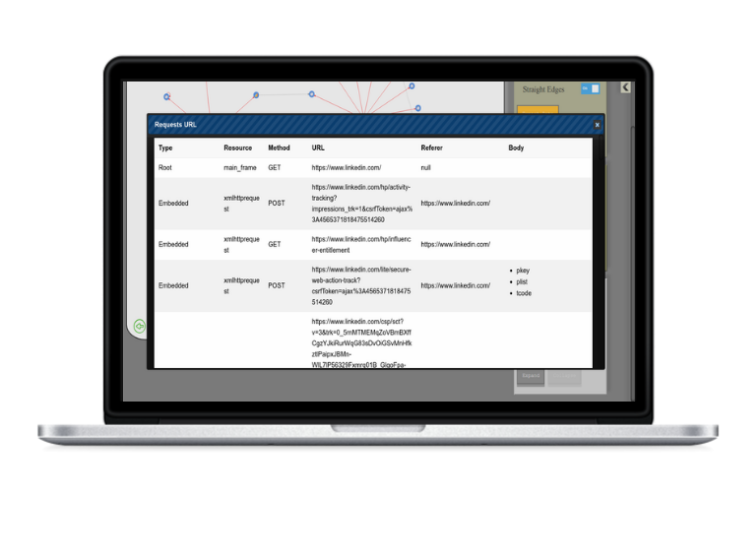
Inspect specific parts of requests
You can look at all requests being made for a specific domain in a table, containing several attributes, such as HTTP request method, resource type, URL, referer and body parameters.
Export the raw captured data
You can export the raw captured data from the application, including all the requests being made by the browser and the redirects performed.
Export the generated visualisation graph
You can also export the generated visualisation graph. This contains all the domain nodes, the resources being requested and related cookies, with the corresponding connections. You can import these data in other data analytics tools.